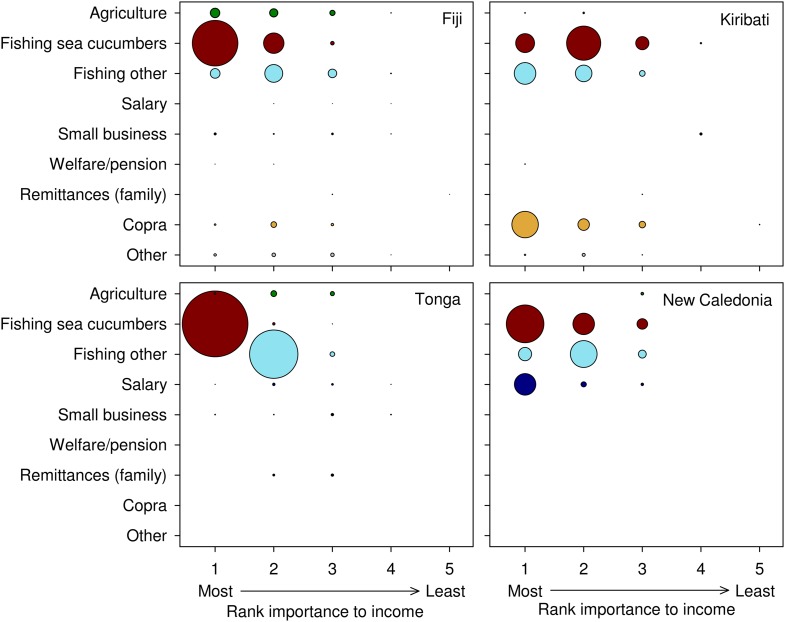
Fig 6. Importance of livelihood activities of fishers.
Bubble diameter is scaled to the proportion of fishers relying on each livelihood activity for their most important to least important source of income at the time of the interview. The activity they get most income from was ranked 1, the activity providing the second-most amount of income was ranked 2, and so on. Some fishers only had one or two income sources, while some others had four or five.

