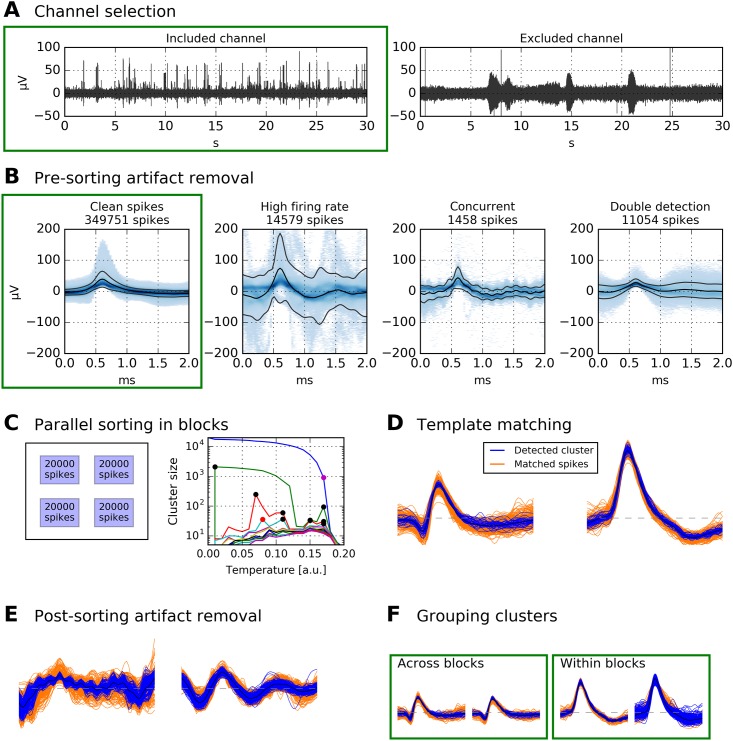
Fig 1. Schematic of data processing. Data displayed in green boxes are passed on to the subsequent stage.
A Channels with no unit activity (i.e., broken or empty channels) are discarded. Displayed are bandpass-filtered recordings of two channels in the human MTL (passband 300 Hz to 1000 Hz). B After spike extraction, pre-sorting artifact rejection is performed. Displayed are density plots of all spikes extracted from a 12-hour recording (same channel as left panel in A). Artifact rejection removes ≈ 27 000 spikes, and ≈ 350 000 remain. C Clean spikes from B are split into blocks of 20 000. In this example, the 350 000 spikes are split into 18 blocks. All blocks are spike-sorted in parallel. For each block, clusters from several “temperatures” are selected. Displayed is an example for one block. Black dots in the temperature plot correspond to clusters that were selected, red dots to clusters that were not selected because their spikes had already been selected at lower temperatures, and the purple dot marks the highest temperature used. Large clusters are again subjected to iterative spike sorting. D Template matching is used to assign the remaining spikes to clusters. E Artifact clusters are removed. F Physiological clusters are grouped, both within each block and across blocks.

