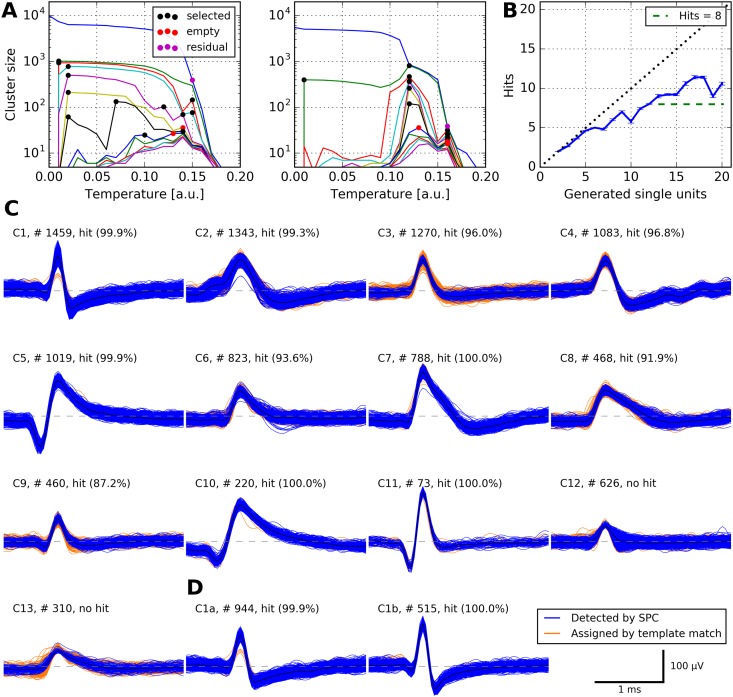
Fig 3. Performance of our algorithm on simulated data.
A Cluster sizes at different temperatures for one of 95 simulations (simulation_5). Each marked location corresponds to an automatically selected cluster; up to Cmax = 7 clusters are selected at each temperature. Left panel, input to this clustering step were all spikes in one simulated channel. Right panel, input to this clustering step were all spikes not assigned to any cluster during the first clustering step. B Performance of our algorithm on all simulated datasets. Each simulated dataset contained action potentials from 2 to 20 neurons. For each simulation, we calculated the number of hits: a unit U generated by our spike sorting method was considered a hit if at least 50% of the spikes in U belonged to one neuron and at least 50% of the spikes of that neuron were in U. Displayed is the number of hits as a function of the number of neurons in the simulations (error bars denote s.e.m.). Note that our algorithm is capable of detecting more than eight neurons, a typical maximum for manual operation of WaveClus [8]. C All automatically generated clusters from simulation_5. Shown are spike counts and the percentage of spikes in the detected unit that actually belonged to the corresponding neuron in the simulation. Eleven clusters were hits, two clusters were no hits. Note that cluster C11 was perfectly detected despite its low firing rate of 0.12 Hz. D Undoing an automatic merge in cluster C1 with our graphical interface generated another hit.

