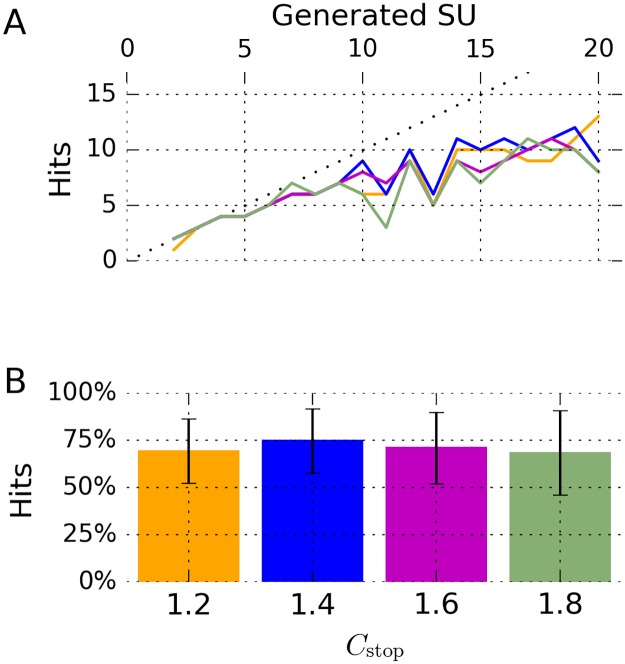
Fig 6. Performance of our algorithm on multi-hour simulated datasets.
A Results for a total of 4 different parameter settings are displayed. The number of hits is shown as a function of the number of neurons in the simulations. See B for color legend. B Each bar represents the mean number of hits as a fraction of the number of neurons present in the simulation. Error bars denote standard deviation. The colors of the bars correspond to the lines in A.

