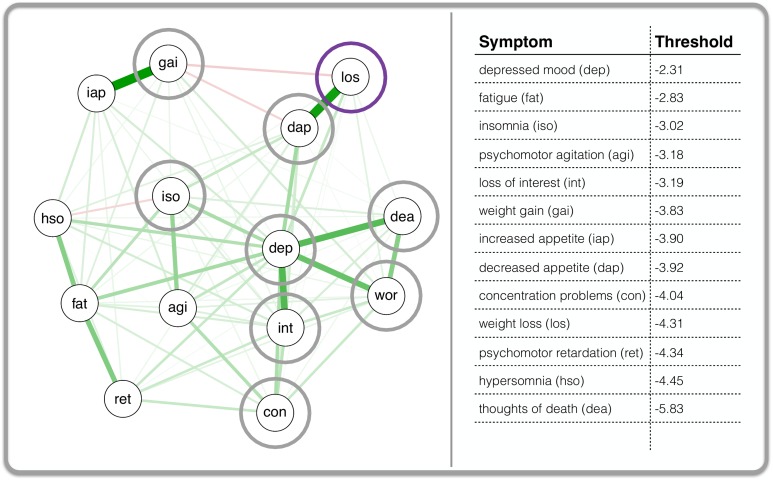
Fig 3. The inter-individual MD symptom network based on the VATSPUD data.
Each node in the left panel of the figure represents one of the 14 disaggregated symptoms of MD according to DSM-III-R. A line (i.e., edge) between any two nodes represents a logistic regression weight: the line is green when that weight is positive, and red when negative. An edge becomes thicker as the regression weight becomes larger. As an example, the grey circles are the neighbor of the symptom that is encircled in purple (i.e., they have a connection with the purple symptom). The right part of the figure shows the estimated thresholds for each symptom. dep: depressed mood; int: loss of interest; los: weight loss; gai: weight gain; dap: decreased appetite; iap: increased appetite; iso: insomnia; hso: hypersomnia; ret: psychomotor retardation; agi: psychomotor agitation; fat: fatigue; wor: feelings of worthlessness; con: concentration problems; dea: thoughts of death.

