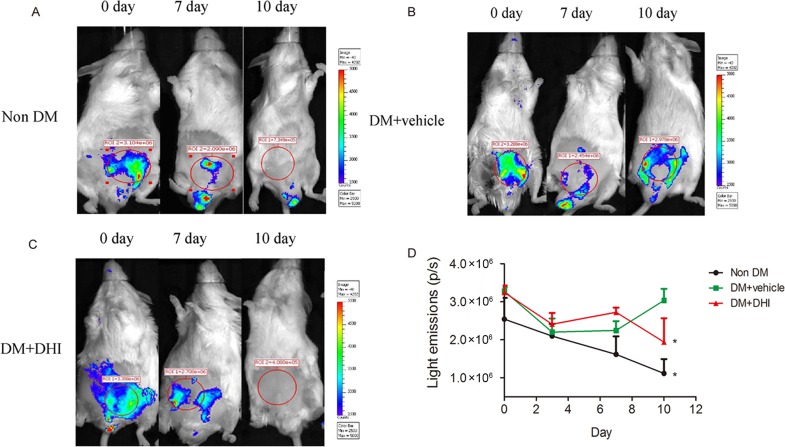
Fig 5. In vivo expression of VEGFR-2 in diabetic VEGFR-2-luc mice.
(A-C) Representative Bioluminescent images of HLI mice were obtained at 0, 7 and 10 days under the same imaging conditions. (D) The dynamic measurement of bioluminescent intensities in non-DM, DM+vehicle and DM+DHI groups. Regions of interest (ROI) from displayed images were identified on the HLI sites and quantified as photons per second (p/s). Data is shown as mean ± SEM. n = 5 in each group. *P<0.05, vs. DM+vehicle.

