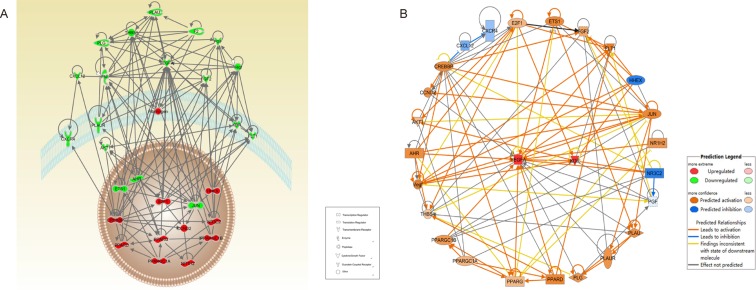
Fig 9. IPA indicated the overlap between angiogenesis and glucose tolerance networks.
(A) Red colored genes are related to glucose tolerance and green colored genes are related to angiogenesis. The arrows indicate effects of regulated genes on other genes. (B) Orange colored are predicted to be activation and blue colored are predicted to be inhibited.

