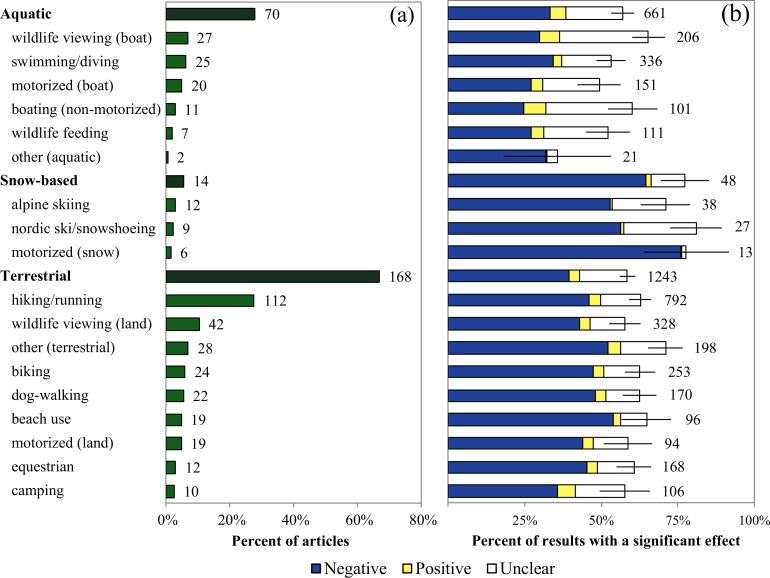
Fig 5. Recreation activities in the articles included in this review.
Panel (a) shows the percent of articles that included each recreation activity (numbers of articles follow the bars), and panel (b) shows the percent of results in which a statistically significant effect of recreation on an animal species was observed (number of results follow the bars). Total percentages are divided into negative, positive, and unclear effects of recreation. Error bars show standard error for the sum of all effects.

