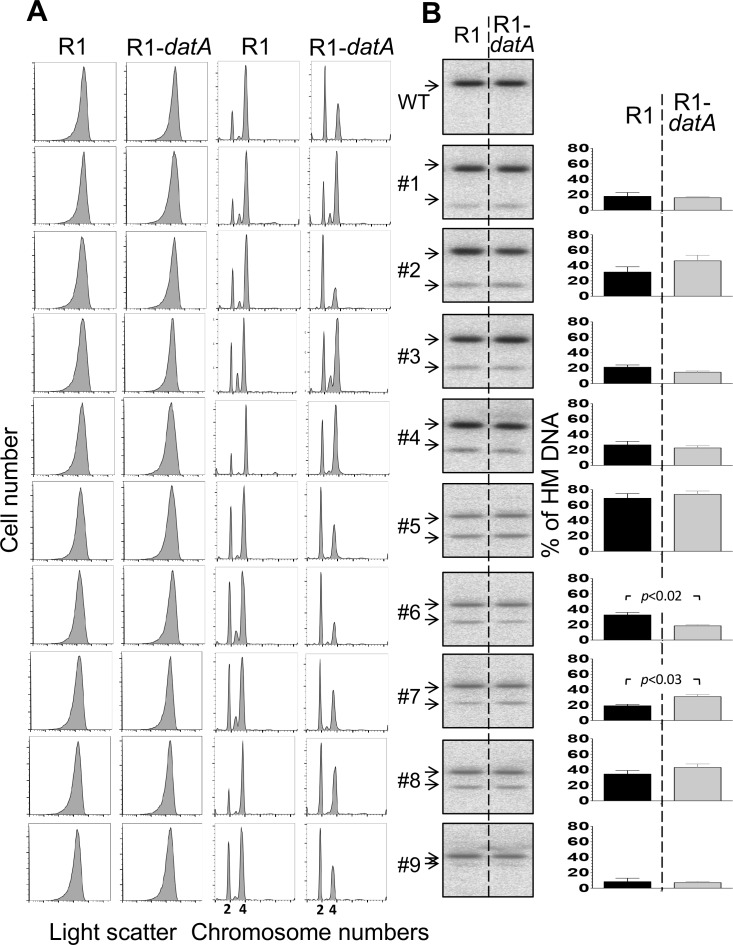
Fig 3. Effect of DnaA titration on cell size, initiation synchrony and HM DNA level at oriC.
(A) Cell size and chromosome content of FRT marked oriC cells without (WT) or with mutations creating TaqI sites #1–9. The cells had an R1 or R1-datA plasmid that was used as a vector control or for titrating DanA-ATP, respectively. Cells were grown at 37°C in supplemented 1X M63 medium up to an OD600 ~ 0.15, and then processed either before or after replication run-out for flow cytometry to measure cell size by light scattering or chromosome content by fluorescence emission, respectively. The multimodal distribution of fluorescence profiles represent cells with different integral number of chromosomes as stated in the abscissa. (B) Southern blots of genomic DNA from cultures in (A) before replication run-out. Black and gray bars represent HM DNA levels in seqA+ strain in the presence of R1 and R1-datA plasmid, respectively. The details are otherwise same as in Fig 2A. Note that band intensities were not quantified for the WT as no cut band was seen or expected because WT oriC does not have a TaqI site in the probed region. The difference in HM DNA levels in the presence of R1 and R1-datA plasmids was considered statistically significant in the case of mutants #6 and #7 only (P < 0.05).

