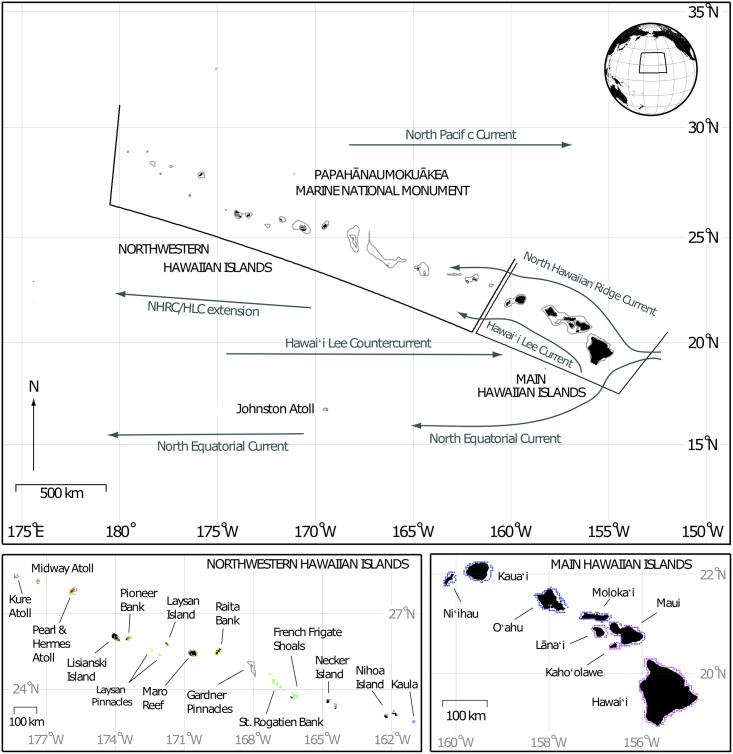
Fig 1. Map of the Hawaiian Archipelago.
Top panel showing the Hawaiian Archipelago domain of the dispersal model with the major surface currents (in green) identified (after Lumpkin 1998). Bathymetry lines denote 1000 and 50 m isobaths. Bottom panels show coral reef habitat pixels for the Northwestern Hawaiian Islands and Main Hawaiian Islands respectively, with each island's habitat pixels shown as a separate color. Bathymetry lines in NWHI denote 50m depth isobath.

