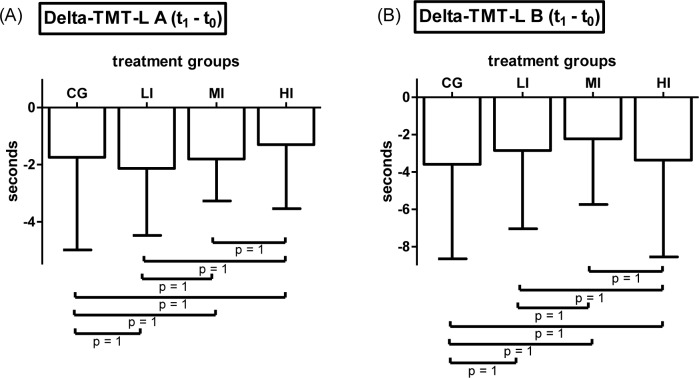
Fig 3. Results of the TMT-L.
(A) Means and SD of baseline to post-assessment difference values of participants`duration to complete part A of the Langensteinbacher version of the Trail Making Test—(Delta-TMT-L A) subdivided by treatment groups. (B) Means and SD of baseline to post-assessment difference values of participants`duration to complete part B of the Langensteinbacher version of the Trail Making Test—(Delta-TMT-L B) (CG = control group (n = 31), LI = low intensity group (n = 30), MI = moderate intensity group (n = 30), HI = high intensity group (n = 30) pairwise comparisons are Bonferroni corrected)

