
Figure 5.
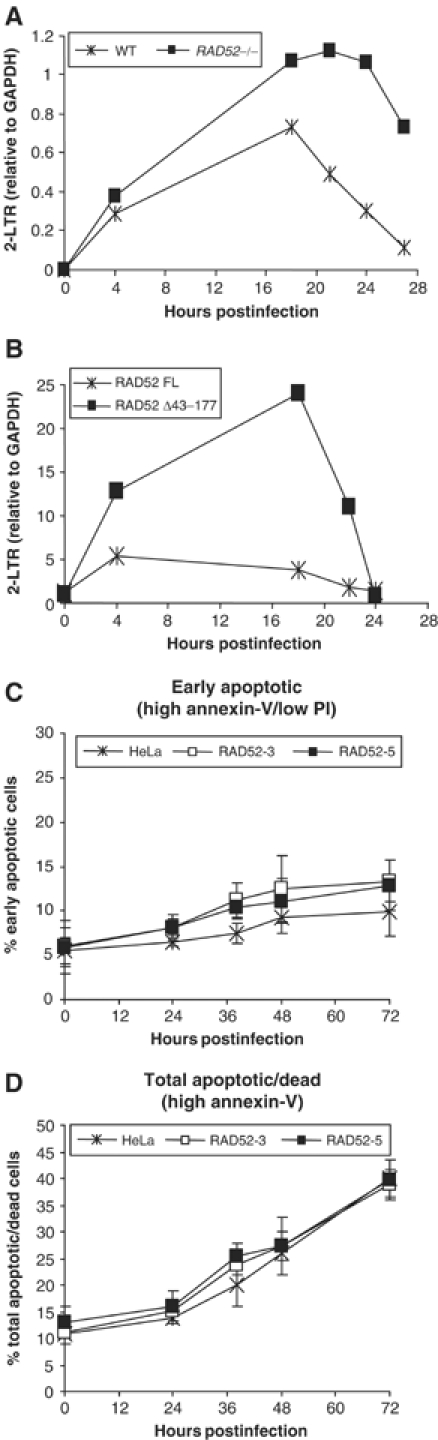
2-LTR circle DNA formation but not apoptosis is modulated by RAD52 expression. Semiquantitative PCR analysis of DNA extracted from HIV-1-infected cells with different levels of RAD52 expression. (A) 2-LTR PCR analysis of wild-type (Rad52+/+; 1B10) and Rad52−/− mouse ES cells. (B) 2-LTR PCR analysis of 293 cells transfected with either full-length HA-RAD52 (RAD52 FL) or DNA-binding deletion mutant HA-RAD52 (RAD52 Δ43–177) expression plasmids. All PCR quantification results are expressed as a normalised ratio of 2-LTR DNA:GAPDH control DNA. HeLa and two RAD52-overexpressing stable cells clones (RAD52-3 and RAD52-5) were infected with HIV-1 and apoptosis was quantified by annexin-V staining and flow cytometry. Live/dead cell discrimination was also performed by counter-staining with propidium iodide (PI). (C) The percentage of cells undergoing the early stages of apoptosis at increasing time points after infection with HIV-1 luciferase retrovirus stocks. (D) The percentage of both dead and apoptotic cells (all high annexin-V-stained cells) at increasing time points after HIV-1 luciferase retrovirus infection.