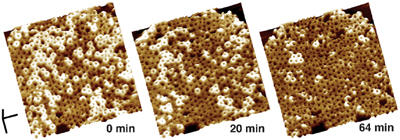
Figure 4.

Direct observation of the change in height upon the conversion of prepore complexes to pores. Sequential images (from left to right) of the same oligomeric complexes of PFOS190C-G57C obtained after the addition of DTT are shown. The first image (0 min) was obtained 30 min after the application of the reducing agent. The complexes are initially at a height of ∼113 Å and decrease to a height of ∼73 Å over time. Scale bar: x, y, 100 nm; z, 10 nm.
