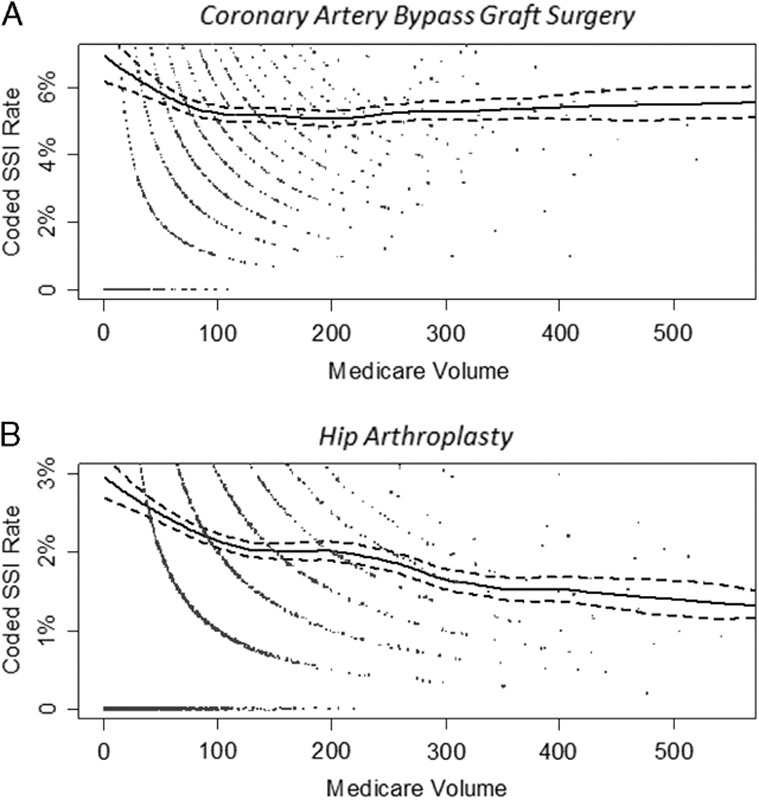
FIGURE 1.

These are plots of the coding for surgical site infection by volume of procedures performed on fee-for-service Medicare patients who underwent coronary artery bypass graft surgery (A) and primary hip arthroplasty (B) in US hospitals in 2011. The dots represent the coding percentages from individual hospitals, jittered slightly to prevent overplotting. The solid line represents 100 times the predicted probability of surgical site infection coding obtained from a generalized additive model, and the dashed lines represent the 95% confidence interval for the predicted probability line. SSI indicates surgical site infection.
