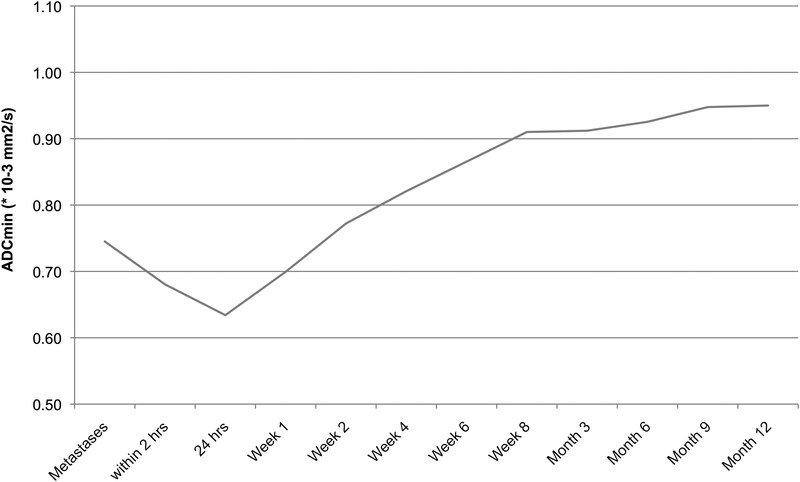
FIGURE 5.

Temporal course of ablation volume ADC. Average ADC values of the ablation zones over time. Note that the first data point is the average ADC of the target lesions treated by IRE. A moderate decrease was observed until 24 hours after the procedure, thereafter the mean ADC of the ablation zone volumes showed a moderate increase until 8 weeks after IRE. In the long course hereafter, still a slight increase was observed.
