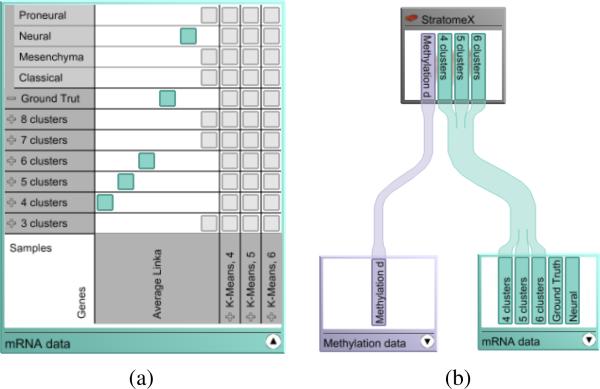
Figure 1.
The two modes of the dataset nodes in the Data-View Integrator. (a) In the detail mode, the patient stratifications and gene clusterings are displayed as a matrix of possible combinations. By selecting one of the gray matrix cells, the user can interactively create a combination (cyan). (b) A view node connected to two dataset nodes that are in compact mode, listing only the existing combinations.

