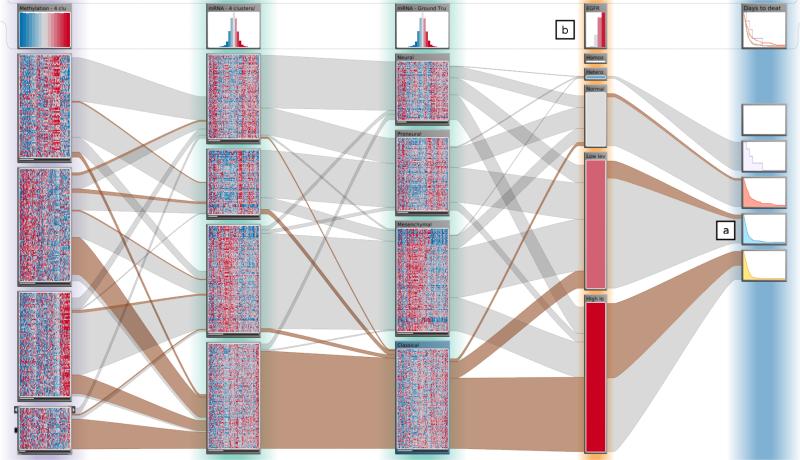
Figure 4.
StratomeX configured as illustrated in Figure 3. The heatmaps in the bricks allow the investigator to judge the homogeneity of the subsets. The header bricks at the top show the name of the column and an overview of the data in the column. In the fourth column, a stratification based on the categories for copy number variation of EGFR can be seen. The rightmost column shows Kaplan-Meier plots for “days to death” as dependent bricks for the copy number-based stratification. Note that patients with amplifications of EGFR have far worse outcomes compared to patients with two copies.

