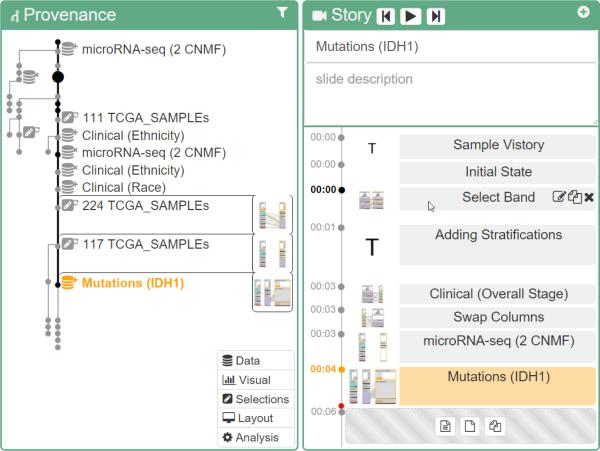
Figure 6.
Close-ups of the provenance and story views. Based on the DoI, exploration states are represented at different levels of detail in the provenance view. The structure of the Vistory, shown on the right, corresponds to a path through the provenance graph, which is shown as a thick black line in the provenance visualization. Both the active slide in the story view and the associated exploration state in the provenance graph are highlighted in orange.

