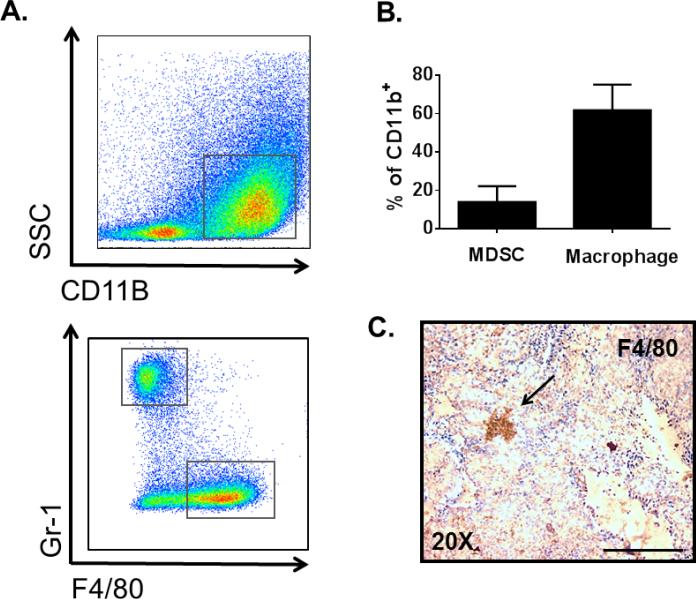
Figure 4.
Macrophages and MDSCs are recruited to HrasG12V/Pten−/− tumors. (A) Top: Representative FACS analysis of myeloid (CD11b+) cells within a HrasG12V/Pten−/− thyroid tumor. Bottom: Representative FACS analysis of macrophage (F4/80+Gr-1-) and MDSC (F4/80−Gr-1+) populations within a HrasG12V/Pten−/− thyroid tumor. (B) Average percentages of MDSCs and Macrophages out of all myeloid derived cells (CD11b+) in HrasG12V/Pten−/− thyroid tumors (N=8). (C) 20X image of 5 μm thick HrasG12V/Pten−/− tumor section immunostained with F4/80 to confirm presence of macrophages (arrow) Scale bar=100 μm.

