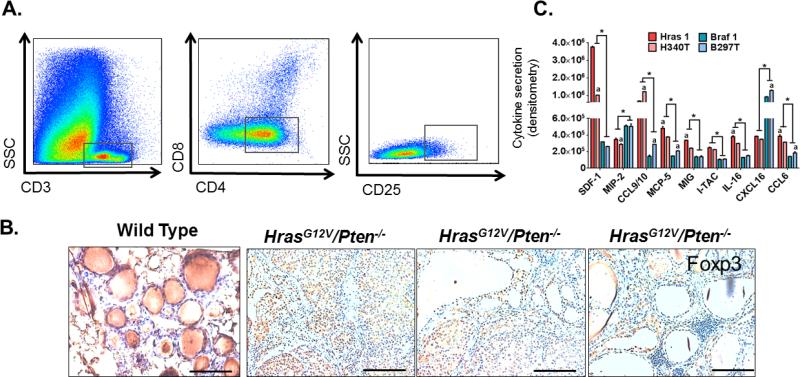
Figure 6.
Recruitment of immunosuppressive Tregs to HrasG12V/Pten−/− thyroid tumors. (A) Representative image of FACS analysis showing gating used to identify T cell populations. CD3+ cells (T-cells) were gated out of all CD45+CD11b− immune cells and further classified according to CD8 expression (cytotoxic T cells) and CD4 expression (T helper cells). CD4 T cells were classified as regulatory T cells (Treg) based on expression of CD25. (B) 20X images of 5 μm thick WT or HrasG12V/Pten−/− tumor tissue sections immunostained with Foxp3, a transcription factor exclusively expressed by immunosuppressive regulatory T cells. In WT thyroid, non-specific DAB staining occurs in thyroid follicles due to presence of colloid, however there no observed Foxp3 nuclear staining in thyrocytes or T-cell populations. Scale bar=100 μm. (C) Cytokine densitometry analysis from conditioned medium isolated from independent tumor cell lines derived from BrafV600E/Pten−/− (Braf1, B297T) and HrasG12V/Pten−/− (Hras1, H340T) thyroid tumors. *, P<0.01, significant difference observed between genotypes (Hras1 versus Braf 1, H340T versus B297T); a, P<0.05, significant difference between values obtained from cell lines of the same genotype (Hras1 versus H340T, Braf1 versus B297T) based on two-way ANOVA with post-hoc analysis (Tukey).

