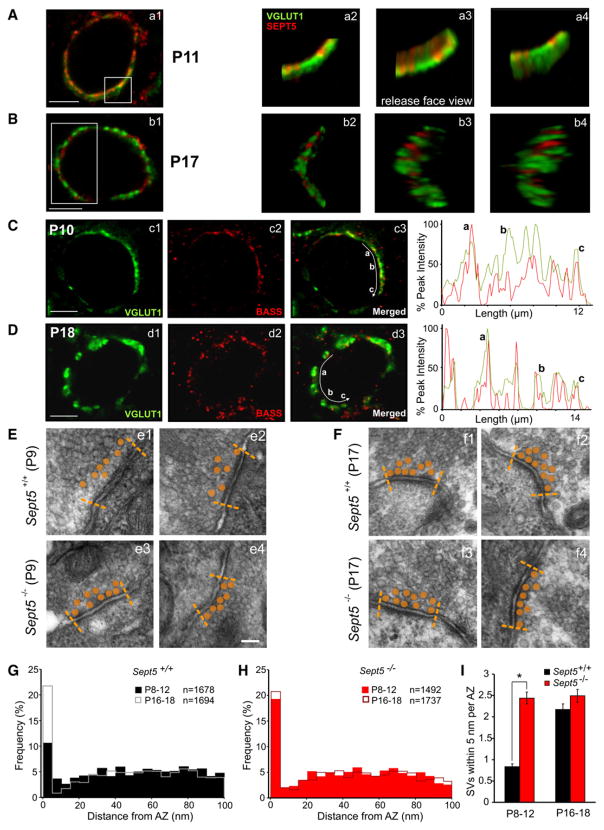
Figure 2. Subsynaptic Organization of SVs and Sept5 in Immature and Mature Calyx of Held Terminals.
(A) Images of a P11 Sept5+/+ calyx costained with vGLUT1 and Sept5 are shown. Boxed region highlights the area of the acquired z stack with enlarged 3D reconstructions displayed to the right. (a2) Reconstruction image with no rotation. (a3) Reconstruction rotated to expose the transmitter release face of the calyx terminal. (a4) Reconstruction rotation to expose opposite side. Note considerable colocalization as shown by yellow color.
(B) Same as (A) but from a P17 Sept5+/+ calyx showing vGLUT1 and Sept5 occupying segregated regions of the calyx of Held terminal, without colocalization.
(C) Images of a P10 calyx terminal stained with vGLUT1 and Bassoon. Curved white arrow in merged image indicates the position and direction of a line scan (far right) performed to measure the fluorescent intensity normalized to the peak intensity of each fluorophore. The position of the white arrow has been shifted just below measured region for clarity. Letters correspond to the red peaks indicated in the line scan plots to the right.
(D) Same as in (C) but vGLUT1 and Bassoon costaining performed in a P18 calyx terminal. Bassoon labeling was occasionally not colocalized with vGLUT1, which may represent the AZs of minor synaptic inputs known to innervate principle MNTB neurons.
(E and F) EM images, taken from immature Sept5+/+ (e1 and e2) and Sept5−/− (e3 and e4) (P9) and mature Sept5+/+ (f1 and f2) and Sept5−/− (f3 and f4) (P17) synapses, of visually identified AZs. Synaptic vesicles (SV) closest to AZ have been shaded in orange for clarity with AZ boundary denoted by dashed lines. Each image in each panel recorded from a different calyx.
(G and H) Summary of normalized histograms plotting SV distance from AZs for immature and mature Sept5+/+ (G) and Sept5−/− (H) synapses. Immature Sept5+/+ synapses are indicated in solid black and immature Sept5−/− in solid red.
(I) The normalized numbers of SVs within the distance of 5 nm from AZs in immature and mature Sept5+/+ (black) and Sept5−/− (red) synapses.
Scale bars in (A)–(D) = 5 μm and in (E) = 100 nm and also applies to (F). * indicates statistical significance (p < 0.05) in this and the following figures.

