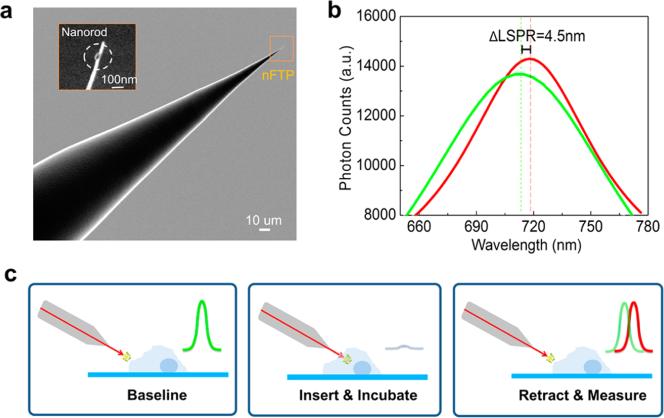
Figure 1.
Nanoplasmonic fiber tip probe (nFTP). (a) Scanning electron micrograph (SEM) image of nFTP. Inset shows a single gold nanorod attached to the nFTP. (b) Localized surface plasmon resonance (LSPR) spectra measured before (green) and after (red) inserting the nFTP into the cell. LSPR spectrum was collected using an electron multiplying charge coupled device (EMCCD) spectrometer (Princeton Instrument) on an inverted microscope (Olympus IX73). (c) During each measurement cycle, nFTP was first regenerated in pH 2.5 glycine solution. 1% bovine serum albumin (BSA) mixed into the cell culture medium (without fetal bovine serum) was then used as the blocking solution. The baseline LSPR spectra were taken in close proximity to the cell. The nFTP was then inserted into the cytoplasm, incubated for 2 min, and retracted from the cell. The signal LSPR spectra were immediately taken at the same focus spot as the baseline spectra. The LSPR shift from the baseline spectra to the signal spectra [ΔLSPR = 4.5 nm in (b)] quantified the intracellular tau-PS262 level.

