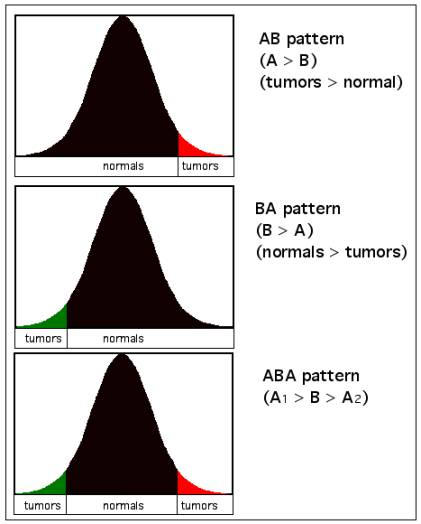
Figure 1.

Conceptual representation of AB, BA, and ABA patterns of differential expression. The colored tails represent the placement of expression values of a given gene in tumors when compared to the distribution of expression values in normal samples. Standard AB and BA patterns are represented by red and black, respectively. Cases in which a surprising number of samples are distributed in both tails for a given gene are represented here as green (BA) and red (AB), respectively, and are painted similarly in Fig. 2 for specific samples.
