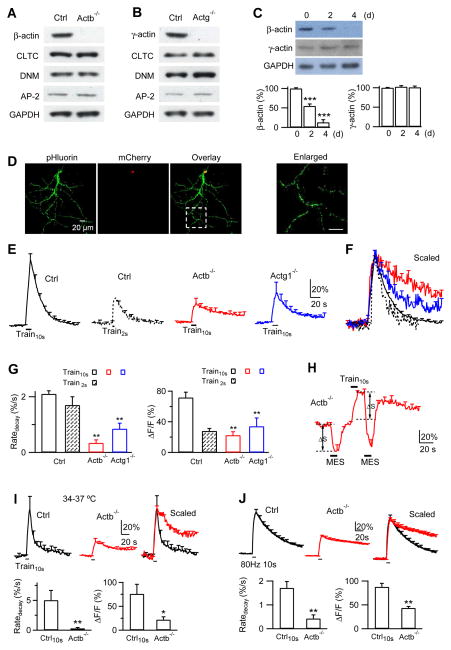
Figure 6. β- or γ-actin knockout inhibits endocytosis at hippocampal synapses.
(A) Western blot of β-actin, AP-2, Clathrin heavy chain (CLT), dynamin (DMN) and GAPDH (Glyceraldehyde 3-phosphate dehydrogenase, loading control) from ActbLoxP/LoxP hippocampal cultures transfected with nothing (Ctrl) or with lentivirus containing a Cre enzyme (Actb−/−).
(B) Similar to A, except from Actg1LoxP/LoxP cultures.
(C) Upper: western blot of β-actin, γ-actin and GAPDH from Cre-ERTM;ActbLoxP/LoxP culture at 0, 2 and 4 days (d) after addition of 4-OH-tamoxifen (1 μM).
Lower: β- (left) and γ-actin (right) western blot intensity from Cre-ERTM;ActbLoxP/LoxP culture at 0, 2 and 4 days after addition of 4-OH-tamoxifen (mean + s.e.m., normalized to day 0, n = 4). ***, p < 0.001 (ANOVA).
(D) SypH and mCherry images of a neuron transfected with SypH and a plasmid containing Cre-mCherry. mCherry is localized to nucleus (superimposed image), due to a nuclear localization sequence tagged at the Cre N-terminal. The box region is enlarged (right) to indicate a place for SypH imaging.
(E) FSypH (mean + s.e.m.) induced by Train10s (left, n = 8 experiments) or Train2s (n = 5) in control boutons, and FSypH induced by Train10s in Actb−/− boutons (ActbLoxP/LoxP boutons transfected with SypH and a Cre plasmid, n = 11) or in Actg1−/− boutons (Actg1LoxP/LoxP boutons transfected with SypH and a Cre plasmid, n = 10). FSypH is normalized to baseline, s.e.m. is plotted every 10 s, temperature was 22–24°C (applies to Figs. 6–8 if not mentioned otherwise).
(F) Traces in E (same color coding) scaled to the same amplitude and superimposed. Train2s was aligned to the end of Train10s.
(G) Ratedecay and ΔF (mean + s.e.m.) induced by Train10s and Train2s in control boutons (Train10s, n = 8; Train2s, n = 5) and by Train10s in Actb−/− (n = 11) and Actg1−/− boutons (n = 10 experiments). ΔF was normalized to baseline F (ΔF/F, applies to all panels in Figs. 6–7). **: p < 0.01, t test (compared to Train10s data in Ctrl).
(H) Applying MES solution (pH:5.5, bars) quenched FSypH (mean + s.e.m.) to a similar level (dotted line) before and after Train10s in Actb−/− boutons (n = 6 experiments). ΔS represents pre-existing SypH molecules at the plasma membrane that can be quenched.
(I) FSypH traces, Ratedecay and ΔF (mean + s.e.m.) induced by Train10s in Ctrl (n = 4, black) or Actb−/− boutons (n = 5 experiments, red) at 34–37°C. Mean FSypH traces were also scaled and superimposed (right). *: p < 0.05; **: p < 0.01, t test.
(J) FSypH traces, Ratedecay and ΔF (mean + s.e.m.) induced by a 10 s train at 80 Hz at 22–24°C in Ctrl (n = 4, black) or Actb−/− boutons (n = 5 experiments, red). Mean FSypH traces were also scaled and superimposed (right). **: p < 0.01, t test.

