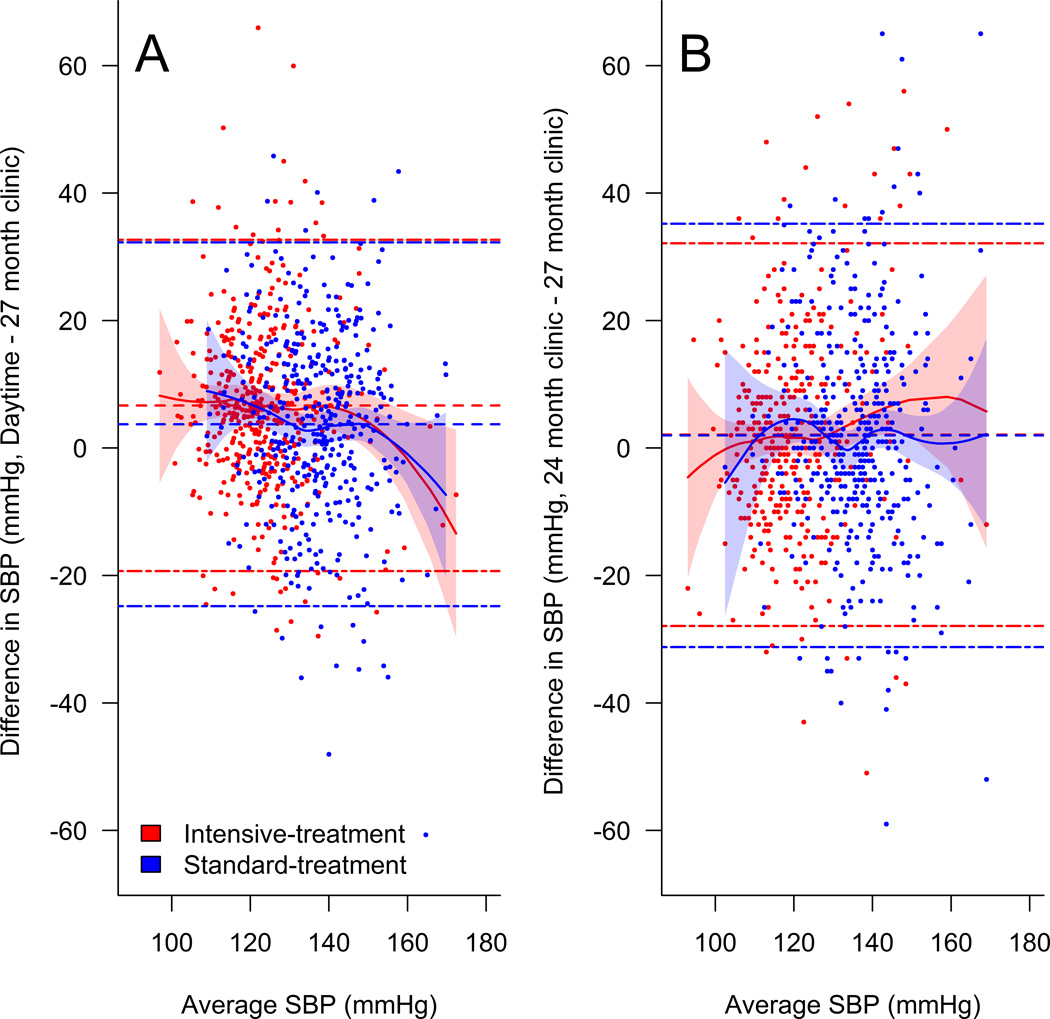
Figure 3.
Daytime readings defined as being between 9:00 am and 9:00 pm. Single dash lines represent mean difference in BP and dash-dot lines denote limits of agreement (±1.96 × SD of difference). Solid lines denote estimated regression fit based on local polynomial regression with 95% point-wise confidence intervals (shaded areas). SBP indicates systolic blood pressure.

