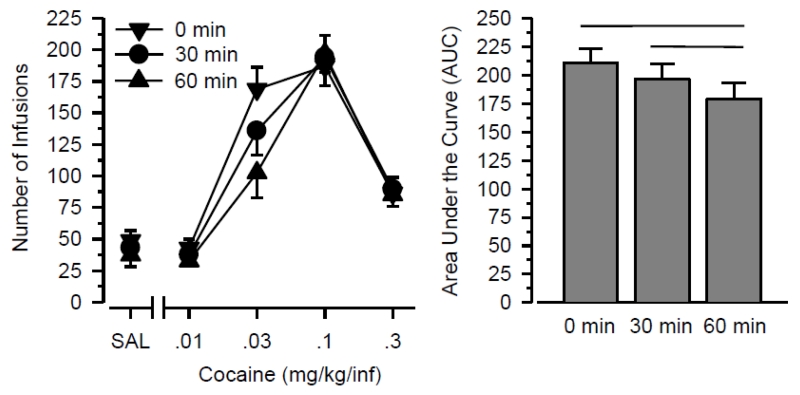
Figure 1.
Cocaine self-administration immediately following wheel running for 0, 30, or 60 min. Left Panel: Number of infusions obtained during 2-hr sessions (vertical axis) when responding was maintained by doses of cocaine and saline (horizontal axis). Right Panel: Area Under the Curve (AUC) values for the dose-effect data. Vertical lines represent the SEM; where not indicated, the SEM fell within the data point. Horizontal lines indicate significant differences between groups. All data reflect the mean of 16 rats.

