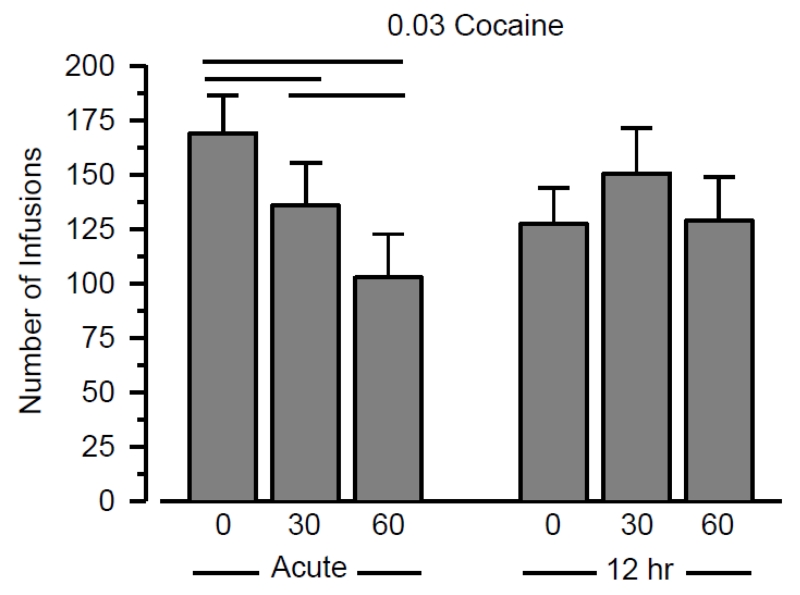
Figure 2.
Responding maintained by 0.03 mg/kg/infusion cocaine immediately (left) or 12 hr (right) following wheel running for 0, 30, or 60 min. Vertical axis depicts number of infusions obtained during 2-hr sessions. Data on left side of panel are redrawn from Figure 1. Vertical lines represent the SEM. Horizontal lines indicates significant differences between groups. All data reflect the mean of 16 rats.

