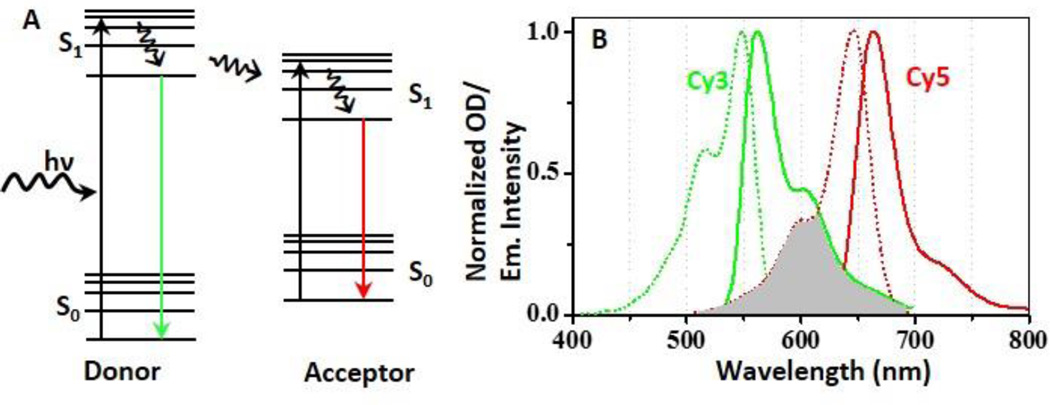
Fig. 1.
A. Simplified Jablonski diagram for fluorescence resonance energy transfer. Solid lines represent rapid electronic transitions, and curved line represents excitation and energy relaxation or transfer. A FRET donor is excited from its ground state (S0) to an excited state (S1) by a photon of energy hν. The excited donor then returns to the ground state by emitting a photon of lower energy (i.e. green fluorescence signal) and donates its energy to a nearby acceptor by dipole-dipole interaction. The excited acceptor then similarly emits a photon (red). B. Excitation (dotted line) and emission spectra (solid line) of a Cy3 (green) and a Cy5 (red) respectively. To trigger efficient FRET, the emission spectrum of the donor (Cy3) should overlap considerably with the absorption spectrum of the acceptor (Cy5), as indicated by the grey color. Data in Fig. B are obtained from the spectral database at the University of Arizona and plotted by OriginPro software.

