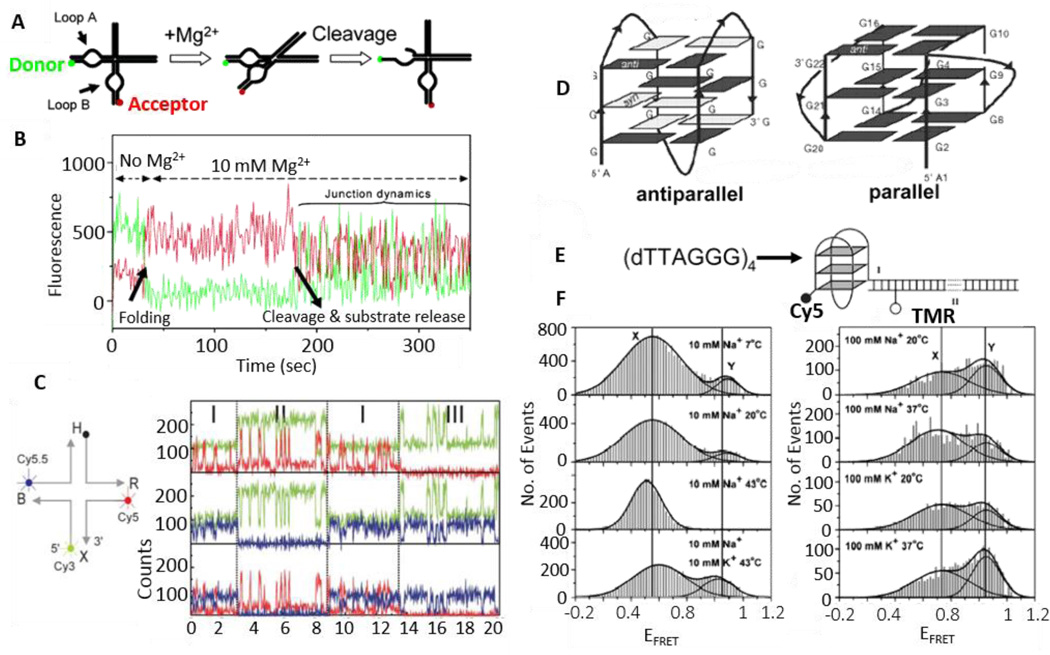
Fig. 10.
Structure and dynamics of nucleic acids revealed by smFRET. A. A simplified scheme for detecting folding and catalysis of the hairpin ribozyme via smFRET between a donor and an acceptor attached to loops A and B respectively. B. The fluorescence trajectories of the donor (green) and the acceptor (red) that measure the folding process of a hairpin ribozyme. Adding Mg2+ (t = 35 s) induces the ribozyme folding, as revealed by the occurrence of smFRET (the decrease of donor signal and increase of acceptor signal). Cleavage and product release occur at 180 s and then the four-way junction dynamics show anti-correlated fluctuations. C. Three-color smFRET to study the structure and dynamics of the Holliday junction. Three-color FRET time traces of Cy3 (green), Cy5 (red) and Cy5.5 (blue) are used to calculate inter-distances among the three dyes. In the region I, all three dyes are active. In the region II, C5.5 is inactive and data from this region is used to calculate distance between Cy3 and Cy5. Similarly, data from region III is used to calculate the distance between Cy3 and Cy5.5. D. Parallel and antiparallel conformations of a human telomeric DNA G-quadruplex. E. The human telomeric sequence is labeled with a FRET pair of Cy5 and TMR. EFRET will be high if a relatively compact G-quadruplex structure is formed. F. FRET efficiency histograms obtained in various solutions containing Na+ or K+ as a function of temperature. Each histogram was fit using two Gaussian peaks. Fig. A and B are reprinted from Ha, 200445 and Fig. C from Hohng et al. 200436 by permission. Fig. D–F are reprinted from Ying et al. by permission.98 Copyright (2003) National Academy of Sciences, U.S.A.

