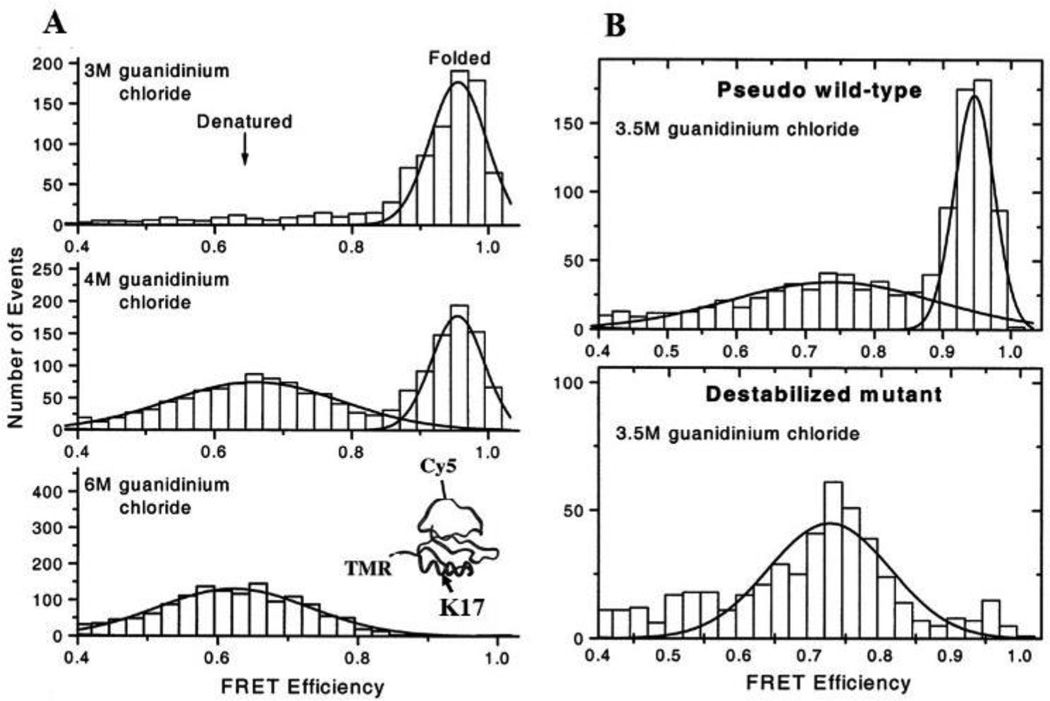
Fig. 4.
Protein folding-unfolding in solution as measured by smFRET assays. A. smFRET histograms at 3 (top), 4 (middle), and 6 (bottom) M of guanidinium chloride. The structure of chymotrypsin inhibitor 2 and the labeling sites of fluorescent dyes (TMR, Cy5) and a mutation site (K17) are shown in inset (bottom). B. FRET histogram comparison of a pseudo wild-type and a destabilized mutant CI2 (K17G) in the presence of 3.5 M guanidinium chloride. Solid lines show Gaussian fits to the distribution of FRET efficiency. Fig. A and B are adopted and reprinted from Deniz et al., 2000 with permission.51 Copyright (2000) National Academy of Sciences, U.S.A.

