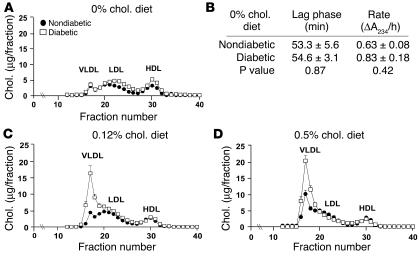
Figure 3.
Diabetic mice fed cholesterol-rich diets developed diabetes-associated lipid abnormalities, while diabetic mice fed a cholesterol-free diet had no diabetes-induced lipid abnormalities. Plasma cholesterol profiles of nondiabetic and diabetic mice fed different diets were analyzed by FPLC (A, C, and D). A 100-μl aliquot of plasma obtained after 12 weeks on the diet was applied to a column filled with Superose 6HR. Each 250-μl fraction was subjected to cholesterol analysis. The results are presented as mean + SEM (A, C, and D) and mean ± SEM (B) of plasma samples obtained from 3 different animals. The major lipoprotein peaks (VLDL, LDL, and HDL) are indicated. Susceptibility of LDL to copper oxidation was measured in LDL fractions isolated from nondiabetic and diabetic mice fed the cholesterol-free diet (B). The appearance (lag phase and rate of formation) of conjugated dienes was measured by a spectrophotometer. Chol., cholesterol.

