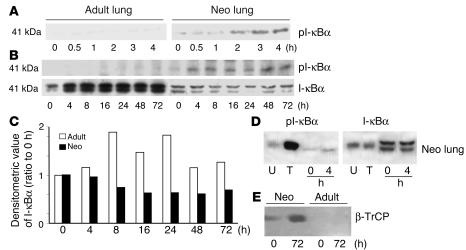
Figure 3.
Maturational differences in pI-κBα, total I-κBα, and β-TrCP in hyperoxia. (A) Expression of pI-κBα at early time points. 0–4 hours, duration of hyperoxia. (B) Expression of I-κBα from 0 to 72 hours of hyperoxia. (C) Densitometric evaluation of I-κBα protein levels from the blot shown in B. (D) Relative mobility of the I-κBα bands after hyperoxia as compared with that in cell extracts with (T) or without (U) TNF-α treatment. Note that the lower band of the I-κBα represents pI-κBα. (E) β-TrCP protein levels after hyperoxia in the nuclear fractions of the mouse lung.

