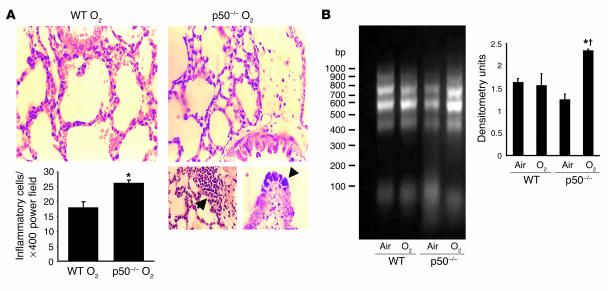
Figure 9.
Lung injury in neonatal p50–/– mice after hyperoxia. (A) Upper panels: Representative H&E-stained lung tissue slide from neonatal WT and p50–/– mice exposed to hyperoxia for 144 hours (O2). The slides were viewed at ×200. Lower left panel: Inflammatory cells per power field. Values are the mean ± SE of 3 animals in each group. *P < 0.05 vs. oxygen-exposed WT mice. Lower right panels: Evaluation of lung injury after 144 hours of hyperoxia. Images were obtained at high magnification (×400); left, increased inflammatory cells in the bronchiolar ephithelium; right, bronchiolar epithelia necrosis. (B) Lung DNA fragmentation in WT and p50–/– mice exposed to 72 hours of hyperoxia. Genomic DNA was isolated, and DNA fragments were amplified by PCR. Left: Visualization of lung DNA fragments in ethidium bromide–stained 0.8% agarose gel. Right: Densitometric evaluation of the agarose gel .Values are the mean ± SE of 3 experiments. *P < 0.05 vs. air-exposed p50–/–; † P < 0.05 vs. O2-exposed WT mice.

