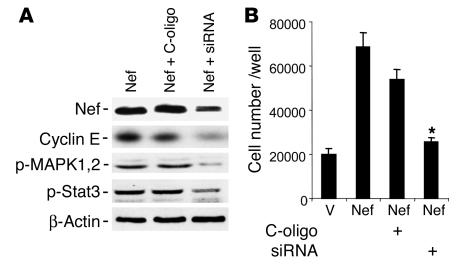
Figure 6.
Effect of Nef siRNA on Nef-induced activity. Nef-infected podocytes were transfected with a mixture of siRNA for Nef or control nonsilencing oligonucleotide for 3 days. (A) Western blot analysis was performed for Nef, cyclin E, phospho-MAPK1,2, phospho-Stat3, and β-actin. Densitometric data: Nef/β-actin ratio: Nef = 1.3 ± 0.1, Nef + C-oligo = 1.19 ± 0.1, Nef + siRNA = 0.52 ± 0.08, P < 0.01 when Nef + siRNA is compared with Nef + C-oligo, n = 3; cyclin E/β-actin ratio: Nef = 0.97 ± 0.16, Nef + C-oligo = 0.92 ± 0.20, Nef + siRNA = 0.35 ± 0.16, P < 0.05 when Nef + siRNA is compared with Nef + C-oligo, n = 4; phospho-MAPK1,2/β-actin ratio: Nef = 0.73 ± 0.12, Nef + C-oligo = 0.67 ± 0.08, Nef + siRNA = 0.11 ± 0.02, P < 0.05 when Nef + siRNA is compared with Nef + C-oligo, n = 4; phospho-Stat3/β-actin ratio: Nef = 0.97 ± 0.13, Nef + C-oligo = 0.81 ± 0.19, Nef + siRNA = 0.27 ± 0.8, P < 0.05 when Nef + siRNA is compared with Nef + C-oligo, n = 4. (B) Cell proliferation assays were performed as described for cells treated with siRNA or control nonsilencing oligonucleotide. *P < 0.001 when Nef + siRNA is compared with Nef + C-oligo, n = 4.

