Figure 8.
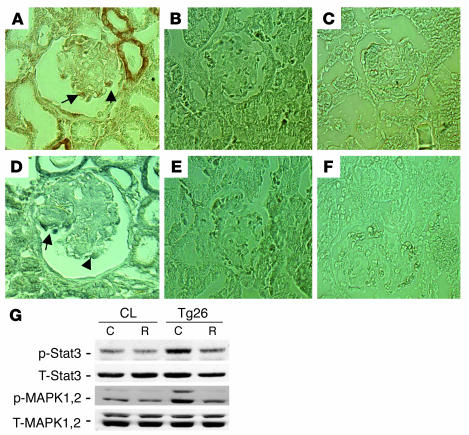
Increased phospho-MAPK1,2 and Stat3 in podocytes from Tg26 mice. (A–F) Immunostaining was performed on kidney sections from 5 Tg26 mice and 4 littermates. Representative pictures are shown. (A) Phospho-MAPK1,2 in a Tg26 mouse. (B) Phospho-MAPK1,2 in littermates. (C) Negative control for phospho-MAPK1,2 using control IgG. (D) Phospho-Stat3 in a Tg26 mouse. (E) Phospho-Stat3 in littermates. (F) Negative control for phospho-Stat3 using control IgG. Arrows indicate positive podocytes. (G) Conditionally immortalized podocytes from Tg26 mice and their littermates (CL) were differentiated at 37°C for 10 days. Then cells were incubated with roscovitine (R) at 20 μM or DMSO (C) overnight before lysis. Western blot was performed as described previously. Densitometric data: phospho-MAPK1,2/total MAPK1,2 ratio: control podocytes, C = 0.17 ± 0.05, R = 0.16 ± 0.04; Tg26 podocytes, C = 0.50 ± 0.09, R = 0.22 ± 0.06; phospho-Stat3/total Stat3 ratio: control podocytes, C = 0.48 ± 0.07, R = 0.38 ± 0.08; Tg26 podocytes, C = 0.72 ± 0.07, R = 0.46 ± 0.08; n = 4; P < 0.05 when R is compared with C in Tg26 podocytes.

