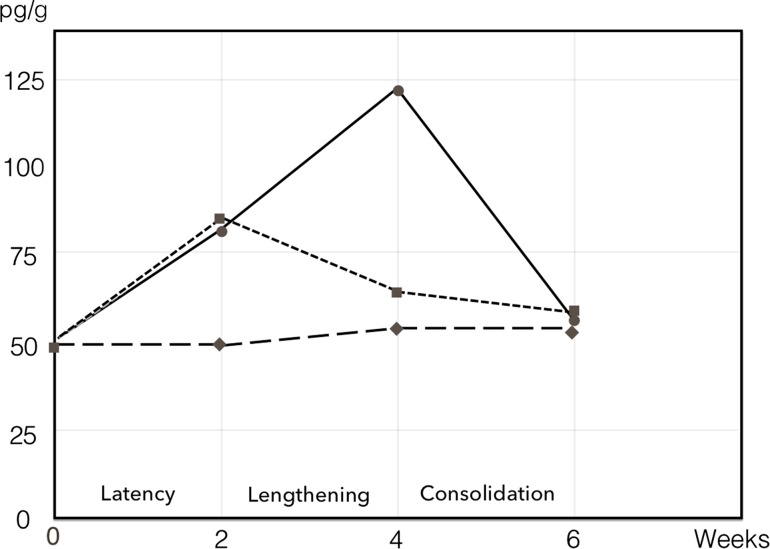
Fig. 1.
IGF-1 in periosteum as a function of time after osteotomy of the tibial shaft in a rabbit model. Mean data for non-osteotomized control tibiae (filled diamond), osteotomized control tibiae (filled square), and lengthened tibiae (filled circle) are shown. Phases of lengthening are indicated. Osteotomy and lengthening values different from control values at 2 weeks, lengthening values different from osteotomy and control values at 4 weeks (P < 0.05)
Data obtained from [2], tables 1–3

