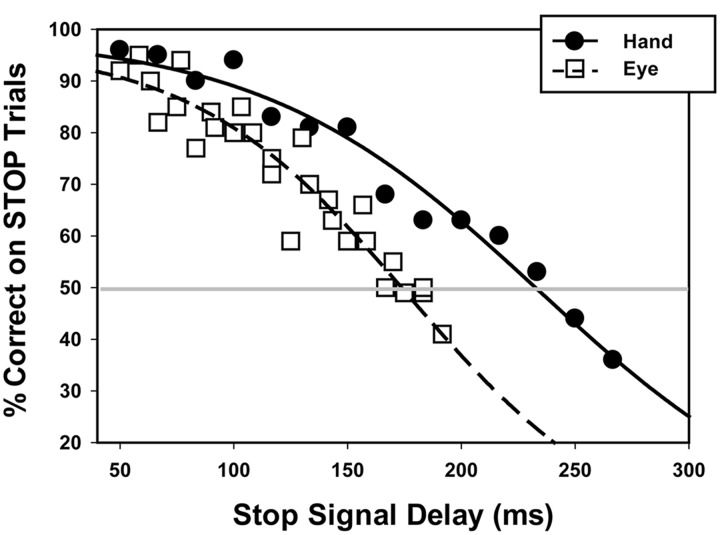
FIGURE 2.
STOP trial accuracy across various Stop Signal Delays during the oculomotor (dashed line) and manual motor (solid line) tasks. Data points represent mean performance across participants at each Stop Signal Delay for the eye (open square) and hand (closed circle). The gray horizontal line is shown to indicate the Stop Signal Delay at which individuals had a 50% probability of accurately inhibiting oculomotor (178 ms) and manual motor responses (227 ms). p50 values shown here are the means across subjects for each effector.

