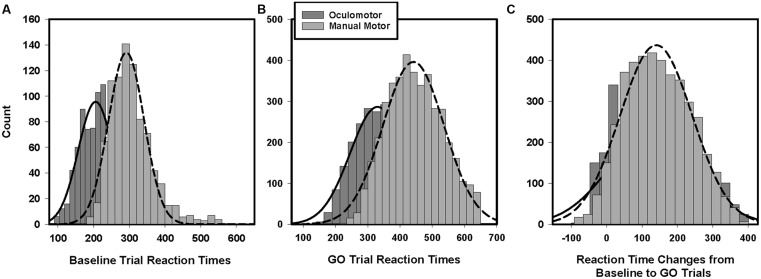
FIGURE 3.
Histograms of baseline and GO trial reaction times. Manual motor reactions times during the baseline trials (A) and GO trials (B) are longer than oculomotor reaction times. Manual motor reaction times also were slowed to a greater degree than oculomotor reaction times from baseline to GO trials (C).

