Figure 1.

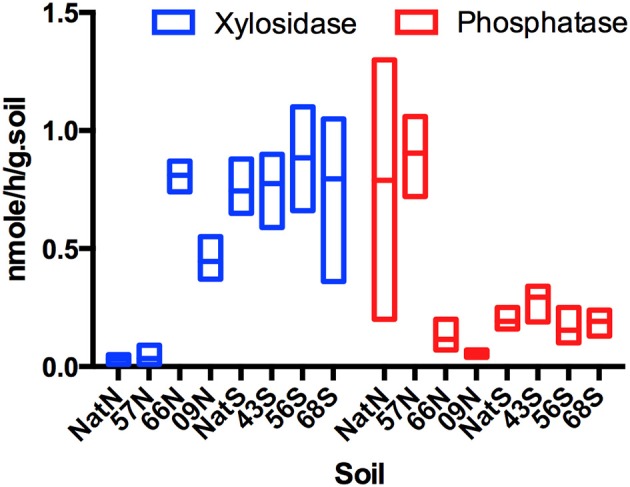
Box Plot of xylosidase and phosphatase activities (nmole/h/gram.Soil) across forest soils. Letters indicate forest soils sample sites followed by year of establishment and are abbreviated as: N, North; S, South and Nat, Native.

Box Plot of xylosidase and phosphatase activities (nmole/h/gram.Soil) across forest soils. Letters indicate forest soils sample sites followed by year of establishment and are abbreviated as: N, North; S, South and Nat, Native.