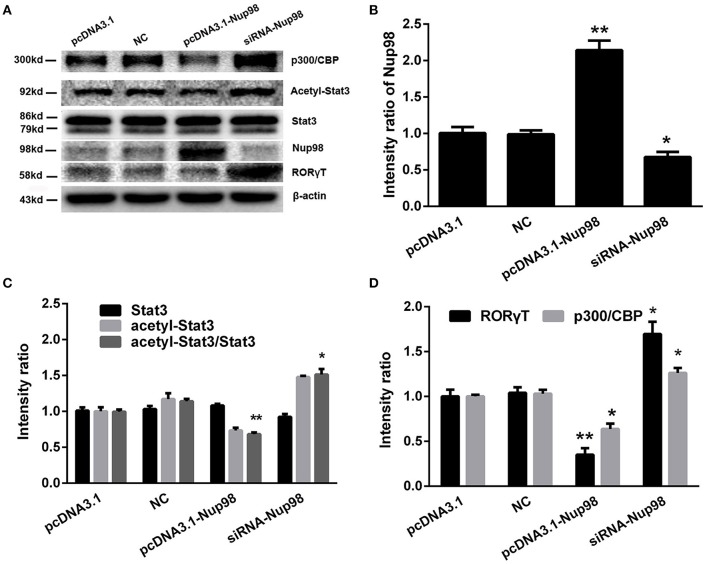
Figure 6.
Nup98 pathway in Th17 differentiation. (A) Representative pictures for the expressions of p300/CBP, acetyl-Stat3, Stat3, and RORγT in CD4+ T cells from peripheral blood in AVMC patients with different interventions. Intensity of each band was measured and normalized to the expression of β-actin. (B) Results of the statistical analysis for the level of Nup98. (C) Results of the statistical analysis for the level of acetyl-Stat3. (D) Results of the statistical analysis for the level of RORγT and p300/CBP. Values represent means ± SEM. *P < 0.05, **P < 0.01 vs. pcDNA3.1 and NC groups. NC: Nonsilencing siRNA sense.

