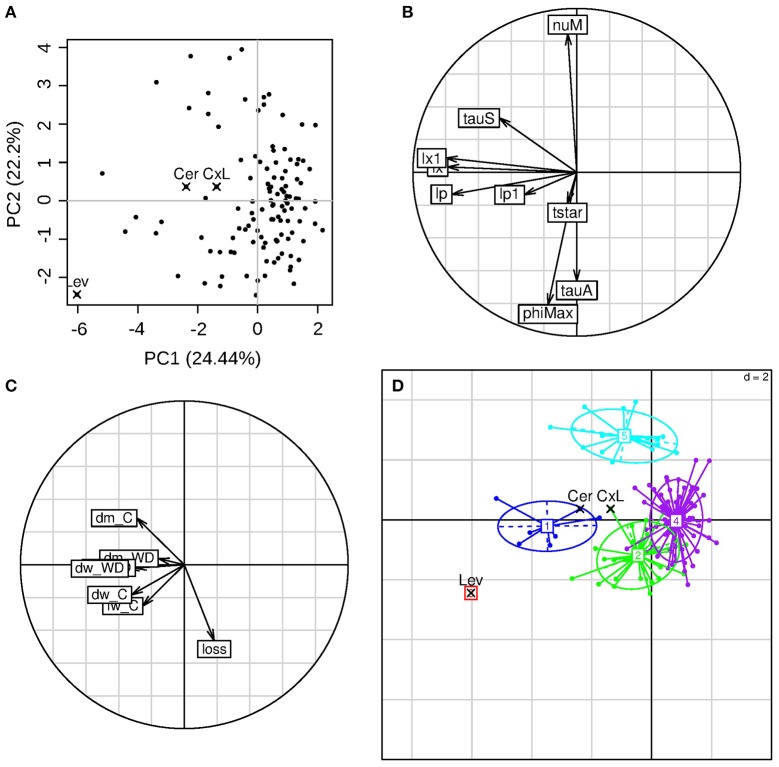
Figure 6.
PCA of the calibration parameter results. (A) Individual's positions in the first two principal components plane, with highlighted values for the parental lines (Cervil and Levovil) and F1 hybrid (CxL); each component explained variance is showed in parenthesis. (B) Variable coordinates normed to the square root of the eigenvalue represented in the correlation circle. (C) Inactive variables coordinates in the correlation circle: dm indicates the dry matter content, dw and fw state for dry and fresh weights of ripe fruits, respectively, loss indicates the fresh mass loss index as computed in Equation (11); (D) Output clusters from the hierarchical cluster analysis.

