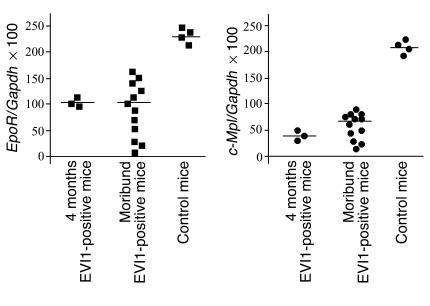
Figure 4.
EVI1 represses the expression of EpoR and c-Mpl. Real-time quantification of EpoR (squares) and c-Mpl (circles) normalized to Gapdh shows a significant decrease of these genes’ median expression in the BM of EVI1-positive mice 4 months after BMT or at the time of their disease-induced death. The results are plotted as the ratio between EpoR or c-Mpl and Gapdh multiplied by 100.

