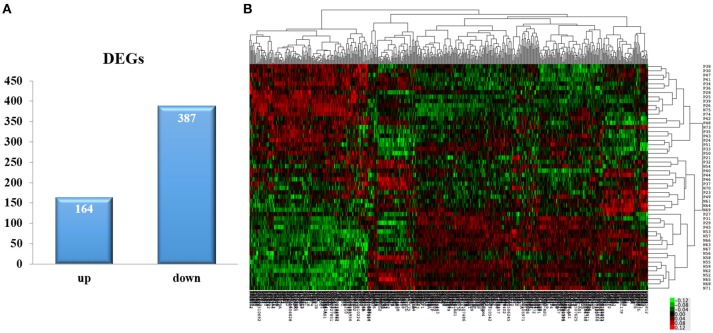
Figure 1.
DEGs selection and hierarchical clustering analysis. (A) The Limma algorithm was applied to filter the DEGs; we selected the DEGs according to P <0.05 and Fold change > 1.2. (B) DEGs can be effectively divided into AMI and control groups. Red indicates that the gene that is upregulated and green represents down-regulated genes.

