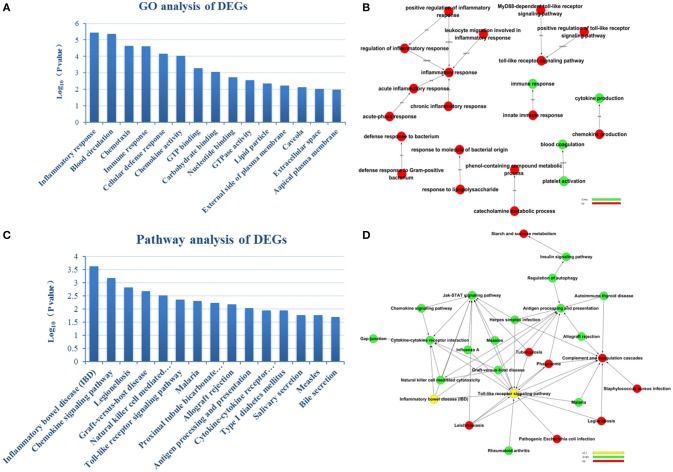
Figure 2.
GO enrichment analysis and GO-Tree. (A) The significant GO terms that conformed to a P <0.05 were screened. (B) GO-Tree: red circles represent the upregulated genes involved in GO terms, and green circles represent the down-regulated genes involved in GO terms. (C) We used the Fisher's exact test to select the significant pathway, identified by a P <0.05. (D) Pathway-act-network. P <0.05. Red circles represent the upregulated genes involved in pathway terms, and green circles represent the down-regulated genes involved in pathway terms.

