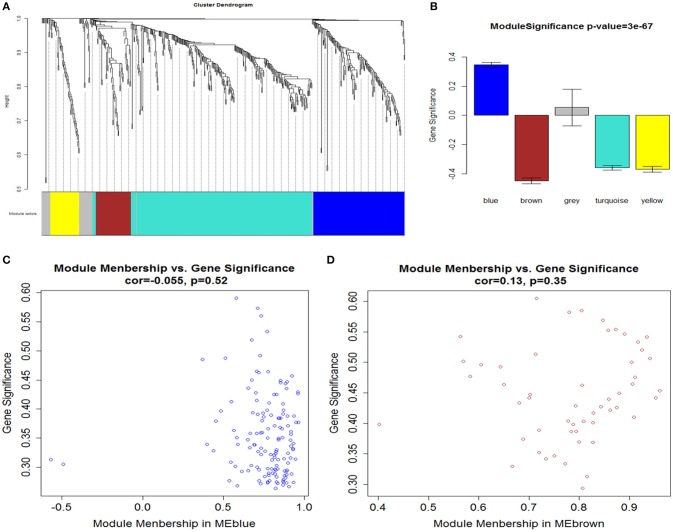
Figure 4.
(A) Network analysis of gene expression in AMI identifies distinct modules of co-expression genes. (B) Correlation between the gene modules and immune and inflammatory responses. Scatter plot of MM vs. GS in (C) blue and (D) brown modules. Cor represents an absolute correlation coefficient of GS and MM; P-value for significance assessment. It follows that in both modules, GS and MM have a high correlation. In the high correlation of image: upper right node (gene) and immune and inflammatory responses, on the other hand in the module also has an important significance.

