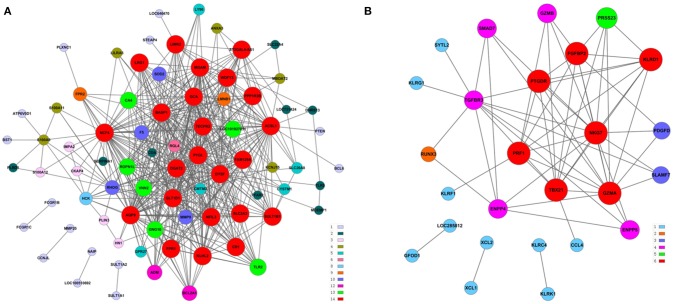
Figure 5.
Construction of a co-expression network of module genes. (A) Blue module; (B) brown module. Red nodes represent the hub genes with the highest K-Core and MM. The node color represents the K-Core. The node size represents the K-Core power, and the edges between two nodes represent the interactions between the genes.

