
Figure 2.
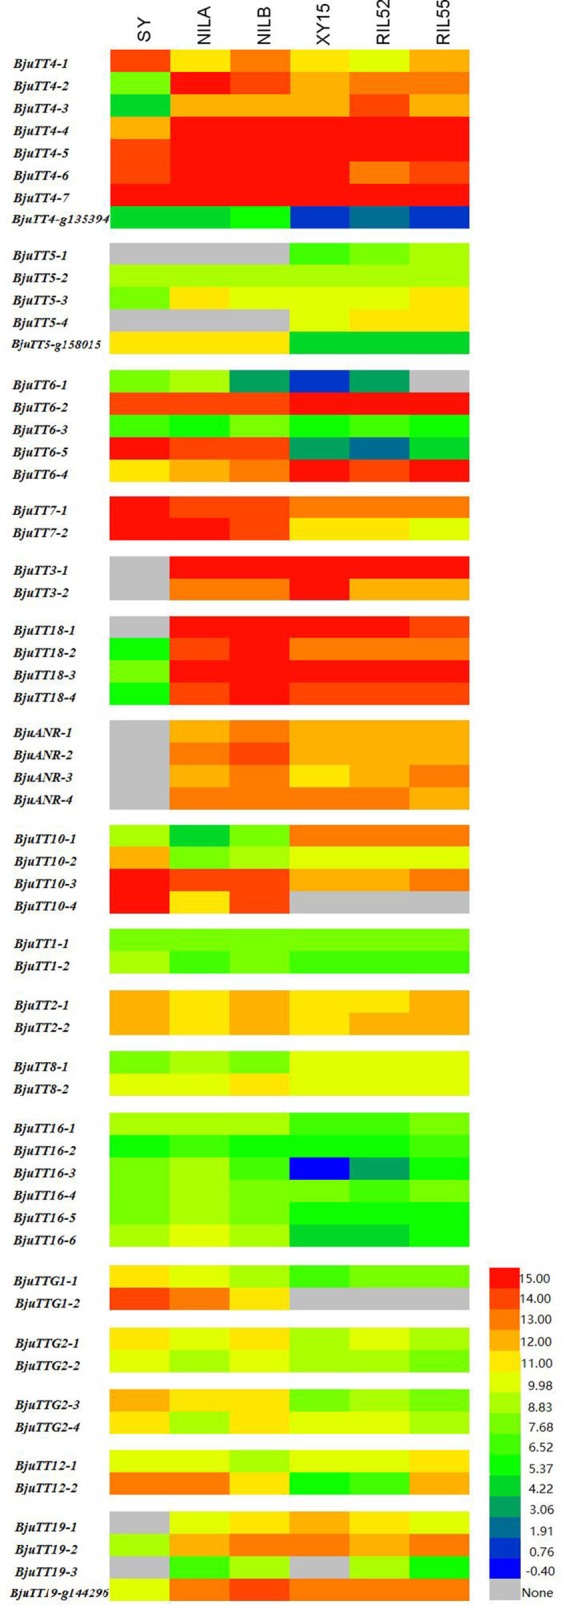
Expession heatmap of gene expression based on FPKM data. NILA, NILB, SY represent the seed coat of B.juncea, and XY15, RIL52, RIL55 represent the seed coat of B.nupus. The color key represents FPKM normalized log2 transformed counts.
Official websites use .gov
A
.gov website belongs to an official
government organization in the United States.
Secure .gov websites use HTTPS
A lock (
) or https:// means you've safely
connected to the .gov website. Share sensitive
information only on official, secure websites.
Expession heatmap of gene expression based on FPKM data. NILA, NILB, SY represent the seed coat of B.juncea, and XY15, RIL52, RIL55 represent the seed coat of B.nupus. The color key represents FPKM normalized log2 transformed counts.