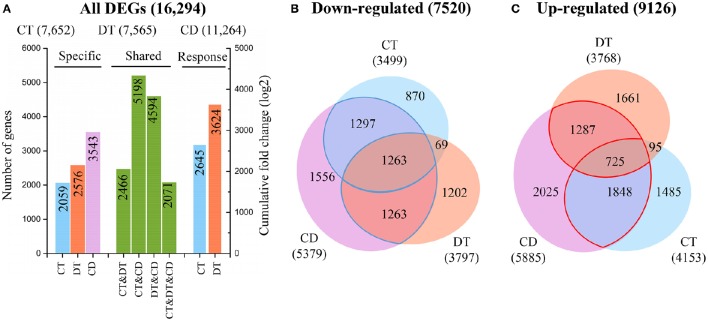
Figure 2.
Relationships between transcriptome responses during CT, DT, and CD. (A) The histogram showing the number of common and specific DEGs during CT, DT, and CD (left), and the cumulative log-fold changes of 1000 most significantly CT- and DT-responding unigenes in CD (right), respectively. Venn diagram of genes (B) down-regulated or (C) up-regulated by each stress. The numbers of common and specific DEGs were shown in the overlapping and non-overlapping regions, respectively. The total numbers of up- and down-regulated DEGs were indicated in parentheses.

