Figure 3.

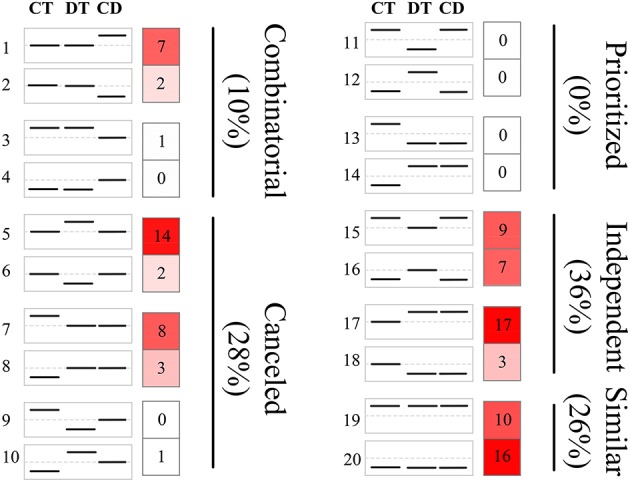
Clustering of unigenes to predefined expression profiles generating the transcriptional response modes. The unigene sets were created by the union of the 500 most significant unigenes for CT, DT, and CD. These unigenes were clustered to 20 predefined expression profiles, each categorizing a potential expression change that may occur when combined stresses are applied. The dotted line in the boxes represents unigene expression with no change compared with the control. The value and color in the right boxes represents the percentage of unigenes that correlate with the particular predefined expression profile (red is higher). Combinatorial, similar levels in the CT and DT but a different response to CD; canceled, unigene response to either CT or DT returned to control levels; prioritized, opposing responses to the CT and DT and one stress response prioritized in response to CD; independent, response to only CT or DT and a similar response to CD; similar, similar responses to CT, DT, and CD.
