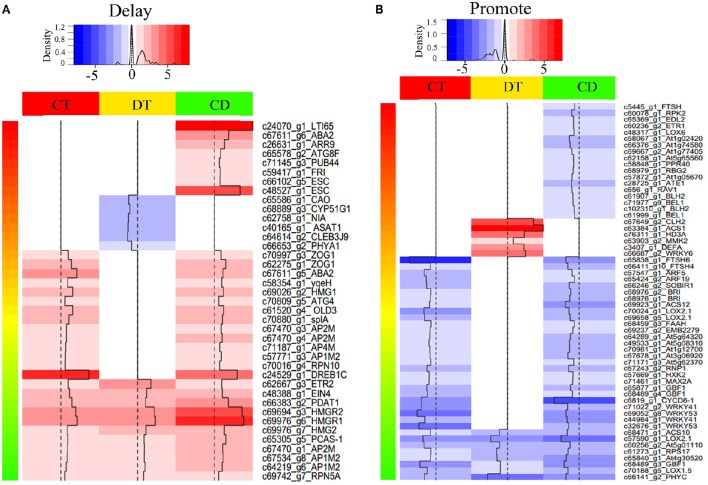
Figure 4.
Heat map of selected differentially expressed SAGs with known effect. Heat map shown the expression level of SAGs with promote (A) or delay (B) effect in LSD. The selection was based on the clustering analysis results (i.e., mode 1, 2, 5, 6, 9, 10, 11, 12, 15, 16, 19, and 20 in Figure 3). Color indicates fold change of DEGs under CT, DT and CD, as shown in the top.

